I worked on an issue at work today that was really interesting (from a technical troubleshooting perspective), so I thought that I’d write about it.
Our organization is in the midst of moving from one datacentre to another. The PKI team reported that their new, just-spun-up servers at the new site were all performing very poorly. Their servers were all running at about 50% CPU usage on an 8 vCPU, 16GB RAM server, but took forever to boot or shutdown, and the GUI had noticible lag when clicking or moving around windows. They suspected a CPU issue - instead of having their 8 vCPU allocated as 8 sockets x 1 core each, they wanted 2 sockets x 4 core, or 1 socket x 8 core because they believed this would improve performance.
According to VMWare, this allocation doesn’t make any real difference in terms of performance since ESXi 6.5/6.7 (but may be needed for licensing compliance).
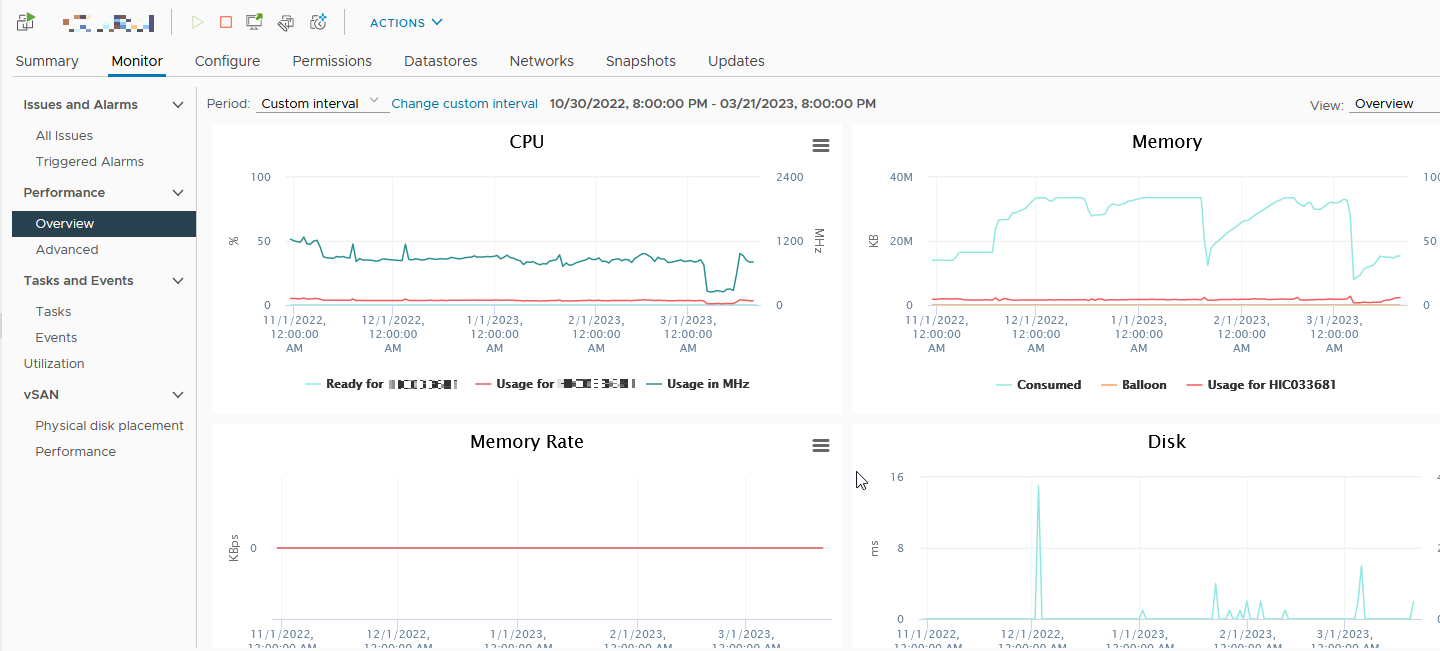
Here’s what the VM metrics looked like:
Migrating to another ESXi host in the cluster made no difference. The host servers in the cluster were all running at about 50% load, so it didn’t seem to be an oversubscription issue (my first suspicion).
Even doubling the resources (to 16 vCPU, 32GB RAM) on a VM made no real difference in performance, although I could see that the VM CPU load dropped to about 30% from 50%.
I found the CPU Ready Time metric and after reading up on what it was and what acceptable values should be, figured out that the problem was that the VM’s CPU couldn’t get scheduled time on the host server.
CPU Ready Time in VSphere is a metric that records the amount of time that a VM is ready to use CPU, but cannot because all CPU resources (on an ESXi host) are busy.
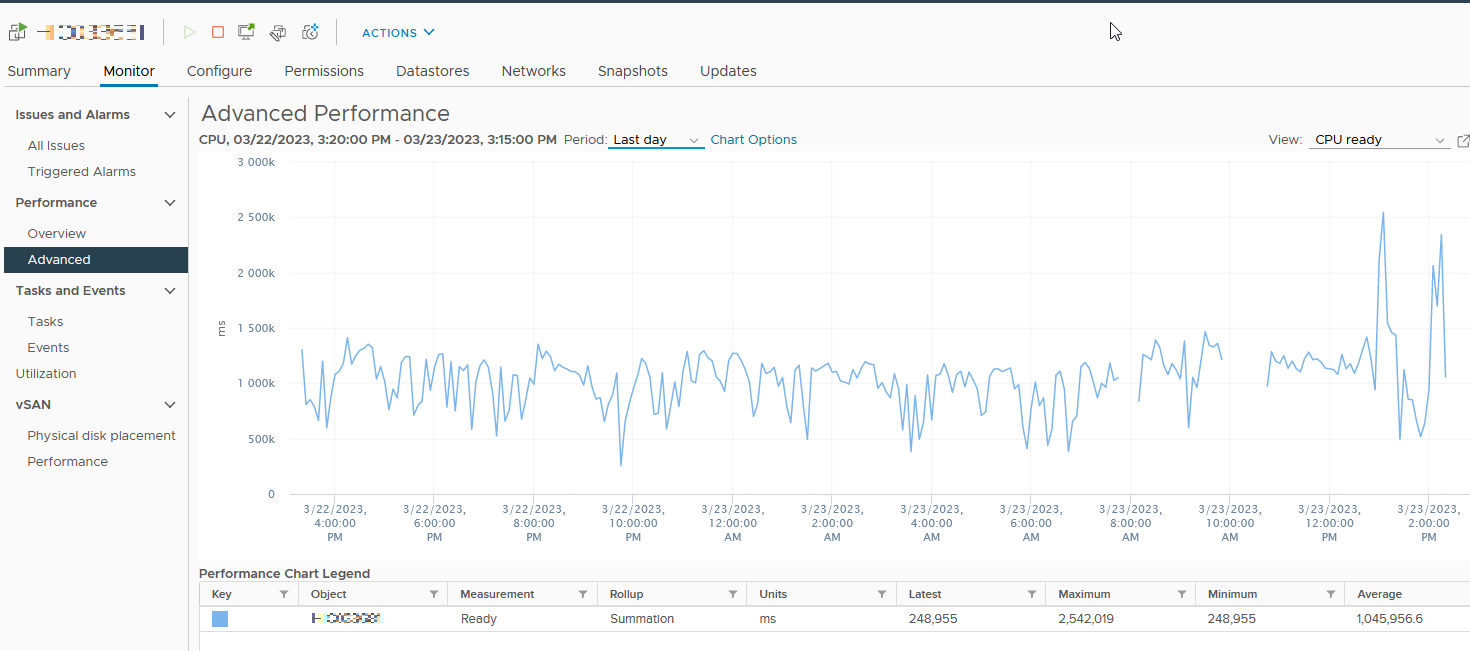
The VM in question was averaging 1000 second wait time for each CPU call (1.05M ms) over the prior day. VMWare documentation suggests that CPU Ready Time at or over 5% could indicate a performance problem. I quickly crunched some numbers using the vmcalc.com website. An average wait time of 1046000ms works out to a CPU Ready Time of about 656%… well above the 5% threshold!
I compared the PKI Server’s CPU Ready Time (1.05M ms) to that of a random server on another cluster, which had an average of just 30 ms!
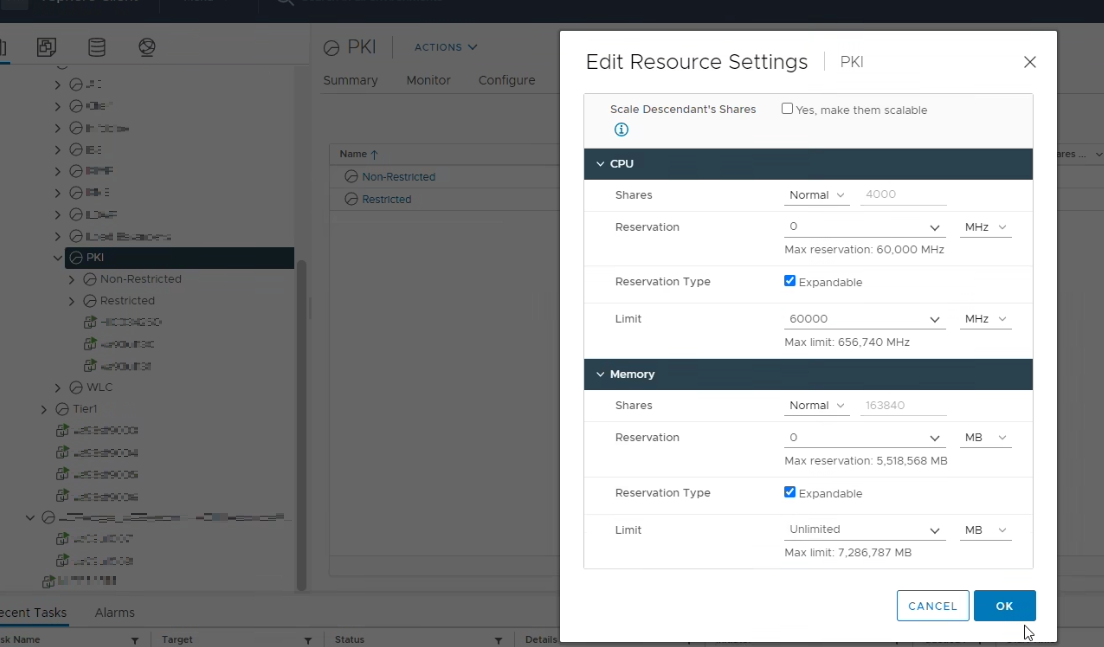
I worked with a colleague to find the cause of this CPU throttling, which turned out to be a Resource Group limit set on the entire PKI ‘folder’, affecting 27 VMs.
We changed the CPU Limit from 30,000 MHz to 60,000 Mhz, effectively doubling the amount of CPU that the servers in this PKI group could consume.
We also checked each VM to make sure that limits were not set on individual VMs. Each one did have the CPU capped to 19200 MHz, which works out to 2.4GHz (when all 8 vCPU are considered). An effective 2.4GHz vCPU rate should be enough to run PKI, so this was contributing to the performance issue that the PKI team was experiencing.
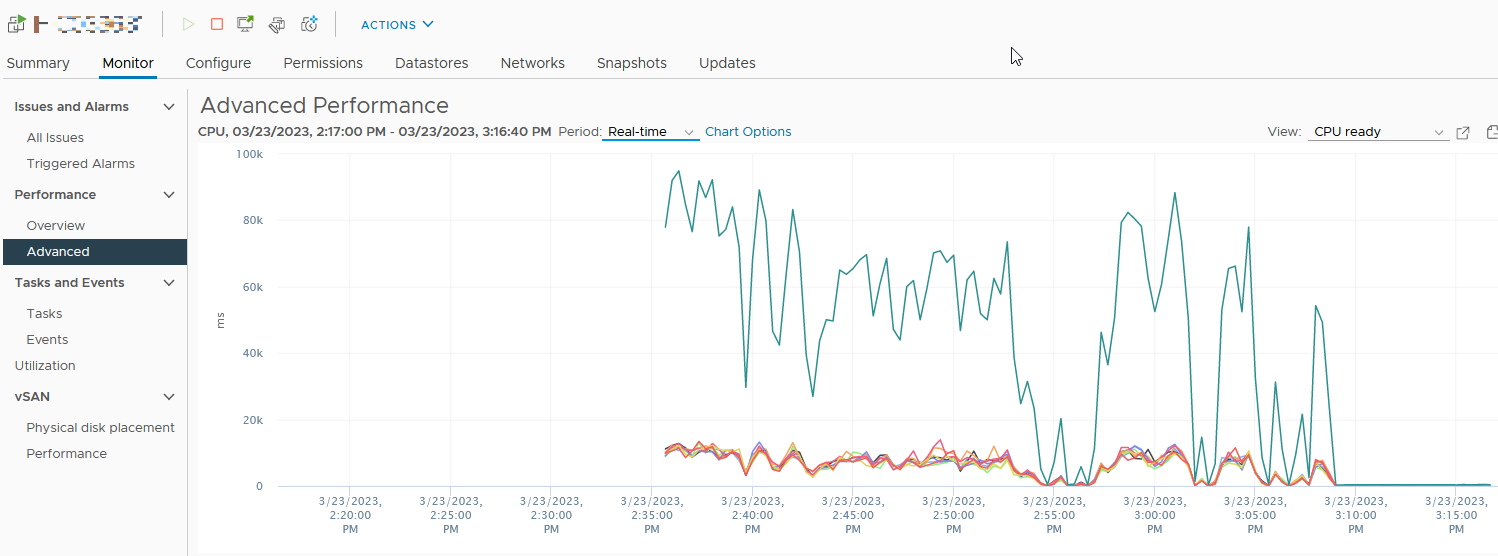
After applying the Limit change, we immediately saw the CPU Ready Time drop on the PKI VMs to something in the 300-400 ms range.
It doesn’t show well in this image because the scale is too vast, but you can clearly see it drop off from 40000-80000 ms to a negligable level.